
Nine metrics run a subscription business: monthly recurring revenue, annual recurring revenue, average revenue per user, gross revenue retention, net revenue retention, subscriber retention rate, involuntary churn rate, customer acquisition cost, and customer lifetime value. Three of those tell you whether the business is healthy. The other six tell you why.
Most subscription teams can produce all nine. Far fewer can produce them the same way twice, because the definitions drift between the finance model, the board deck, and the operating dashboard. The metrics problem in subscription is almost never a reporting problem. It is a definitions problem.
Two of the largest subscription billing networks in the world published churn benchmarks in the last year. One reports median annual churn of 3.22% for software. The other reports 38%.
Sources: Recurly network data, July 2026. Stripe data analyzed by Churnkey, November 2025.
Both are primary. Both are credible. They are measuring different things and calling them the same name.
The reconciliation: eight datasets, one metric, no agreement
Below is every published subscription churn benchmark we could locate from the last eighteen months, normalized into one table. Sample, stated period, and provenance are shown because those three columns are the entire story.
Provenance key. Primary means the organization publishing the figure holds the underlying transaction data. Secondary means a third party compiled it from primary sources. Every figure here is vendor published, because in this category vendors hold the data and no neutral body publishes an equivalent.
|
Source |
Sample | Segment | Stated period | Total | Voluntary | Involuntary | Involuntary share | Provenance |
| Recurly, Jul 2026 | Recurly merchant network | All industries | Annual | 3.27% | 2.34% | 1.25% | 38% | Primary |
| Recurly, Jul 2026 | Recurly merchant network | Ecommerce | Annual | 4.25% | 2.87% | 1.38% | 32% | Primary |
| Recurly, Jul 2026 | Recurly merchant network | SaaS | Annual | 3.22% | 2.16% | 1.06% | 33% | Primary |
| Recurly, Jul 2026 | Recurly merchant network | Education | Annual | 4.99% | 3.30% | 1.69% | 34% | Primary |
| Stripe via Churnkey, Nov 2025 | 200M subscriptions, 1.4T dollars 2024 volume | Merchandise | Annual | 39% | 30% | 9% | 23% | Primary |
| Stripe via Churnkey, Nov 2025 | Same | SaaS | Annual | 38% | 30% | 8% | 22% | Primary |
| Stripe via Churnkey, Nov 2025 | Same | Travel and lodging | Annual | 43% | 35% | 8% | 18% | Primary |
| Stripe via Churnkey, Nov 2025 | Same | Insurance | Annual | 37% | 34% | 3% | 9% | Primary |
| Recharge, via SubSummit 2024 outlook | Recharge DTC merchant panel | DTC physical goods | Monthly | 7.1% | 4.1% | 3.0% | 42% | Secondary |
| Recurly, via third party index | Not restated | Consumer goods | Monthly | 6.5% | Not given | Not given | Not given | Secondary |
| Paddle, via Baremetrics | Not published | Subscription, broad | Not stated | Not given | Not given | Not given | 20 to 40% |
Secondary |
What the table shows
The absolute rates cannot be reconciled. Recurly reports 3.22% for SaaS and labels it annual. Stripe reports 38% for SaaS and labels it annual. That is not a rounding difference or a sampling difference. It is a definitional one, and neither publishes enough methodology to close it from the outside.
Recurly’s figures behave like a monthly rate expressed against a full active base. Stripe’s behave like an annual cohort survival loss, which is what you get when you ask what share of the customers acquired in a year are gone by the end of it. Note that a third-party index reports a Recurly consumer goods figure of 6.5% and labels it monthly, while Recurly’s own page labels its figures annual. The same publisher’s data appears under two different period labels depending on who is quoting it.
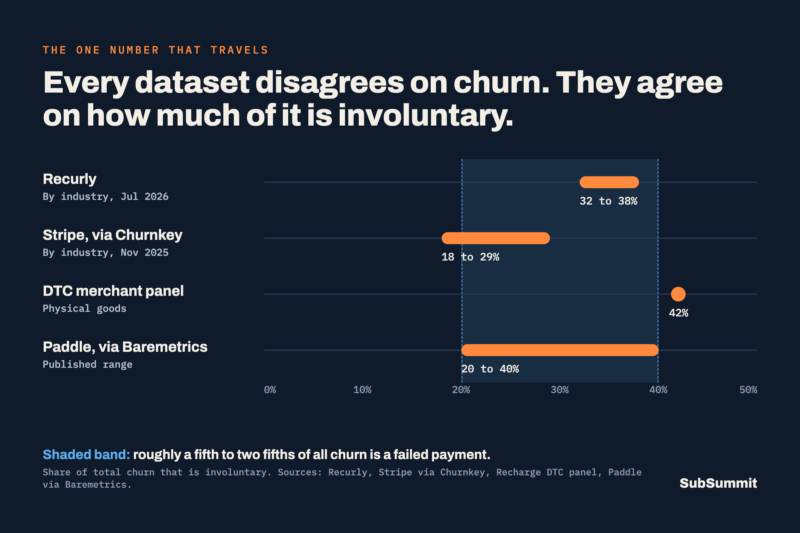
The ratio is stable. Strip out the absolute rate and look only at what share of churn is involuntary, and eight independent readings converge on roughly a fifth to two fifths. Recurly’s own numbers imply 32 to 38%. Stripe’s imply 18 to 29% by industry and 24% for B2C against 16% for B2B. The DTC panel figure is 42%. Paddle’s published range is 20 to 40%.
That is the useful finding. The involuntary share of churn is the only number in this entire category that survives being moved between datasets. Everything else is a function of how the publisher defined its denominator.
Price point predicts the share better than category does. Stripe’s data puts involuntary churn at 35% of total churn below 10 dollars average order value, falling to 15% in the 1,000-to-10,000-dollar band. Recurly’s revenue per customer cut shows the identical shape from the other side: 1.30% involuntary in the 10-to-25-dollar band against 0.18% above 250 dollars, an 87% drop across the range.
For a DTC subscription brand at a typical consumer price point, that is the single most important line in this report. Your involuntary share sits at the high end of every range in the table.
Four rules this produces
- Never benchmark against a published churn rate without reading its methodology. If the methodology is not published, the figure is not usable. Several widely circulated numbers in this category have no traceable methodology at all.
- Never compare two published figures to each other. They almost certainly use different denominators.
- Use ratios, not rates, when you borrow from outside. The involuntary share travels between datasets. The churn rate does not.
- Write down your own definitions. The reason the industry cannot agree on a benchmark is that most individual companies have not agreed internally either. Everything in the rest of this report assumes you have a metrics dictionary. Most teams do not.
Section one: the revenue metrics
Monthly recurring revenue, and the movement that produces it
Definition: the normalized recurring revenue your active subscriber base generates in a calendar month.
The top line number is close to useless on its own. The version that runs a business is the MRR movement waterfall, which decomposes the change between two months into five components that must reconcile exactly:
Ending MRR = Beginning MRR + New MRR + Expansion MRR + Reactivation MRR − Contraction MRR − Churned MRR
If that identity does not balance to zero variance, your subscription event data has gaps, and every metric downstream of it inherits those gaps.
The five components, defined precisely because this is where most drift happens:
- New MRR. Recurring revenue from subscribers who had no prior active subscription. First time only.
- Expansion MRR. Increased recurring revenue from subscribers who were active in both periods. Upgrades, seat additions, quantity increases, price increases that took effect.
- Reactivation MRR. Recurring revenue from subscribers who were previously active, then inactive for at least one full period, and are now active again. Track this separately or it inflates New MRR and corrupts your acquisition cost per new customer.
- Contraction MRR. Decreased recurring revenue from subscribers active in both periods. Downgrades, seat removals, discounts applied.
- Churned MRR. Recurring revenue from subscribers active in the prior period and inactive in this one. Includes both voluntary cancellation and involuntary loss to failed payment. Split it into those two, always.
Normalization rules, which need to be written down and enforced:
- Annual and multi-month plans convert to a monthly figure by dividing contract value by the number of months in the term. Do not book annual contracts as a spike in the month collected.
- One-time charges, setup fees, shipping, and services revenue are excluded. They are revenue but they are not recurring.
- Discounts are netted out. Report MRR on what the customer actually pays, not on list price.
- Taxes are excluded.
- Currency is converted at a fixed rate held constant for the reporting period, not at spot on each transaction, or exchange movement will show up as false expansion and contraction.
- Paused or skipped subscriptions need an explicit rule. Most operators treat a pause under a defined ceiling as contraction rather than churn, and a pause beyond that ceiling as churn. Whichever you choose, choose it once.
The quick ratio
Quick ratio = (New MRR + Expansion MRR) ÷ (Contraction MRR + Churned MRR)
One number that expresses how efficiently the business converts growth into net growth. A quick ratio of 4 means you add four dollars of recurring revenue for every dollar you lose. A quick ratio of 1 means you are running hard to stand still, regardless of how good the acquisition numbers look in isolation.
This is the fastest diagnostic on the list and almost no consumer subscription business reports it.
Annual recurring revenue
Definition: MRR multiplied by twelve, representing the annualized run rate of the currently active base.
ARR is a communication metric, not an operating one. It is what a board, a lender, or an acquirer asks for. Two disciplines matter:
Only contracted recurring revenue counts. One-time purchases, implementation fees, and services revenue do not belong in ARR. Mixing them in is the single fastest way to lose credibility in diligence, because the first thing a competent buyer does is reconcile your stated ARR against your recognized revenue and your deferred revenue balance.
ARR is not revenue. ARR is a run rate snapshot at a point in time. GAAP revenue is what was recognized over a period. They will not match, and reporting one while labeling it the other is a material misstatement in any financing context.
Average revenue per user
Definition: total recurring revenue divided by active subscribers in the same period.
ARPU is the honest test of pricing. If subscriber count is rising while ARPU falls, you are acquiring progressively cheaper customers and calling it growth.
Track ARPU by acquisition cohort rather than in aggregate. Aggregate ARPU blends a 2023 cohort priced under an old model with a 2026 cohort priced under the current one, and the blend hides the trend that matters.
Section two: the retention metrics
Gross revenue retention
GRR = (Beginning MRR − Contraction MRR − Churned MRR) ÷ Beginning MRR × 100
GRR counts only what you lost from the existing base. It cannot exceed 100%. It is the floor of your business, the answer to what happens if you acquire nobody at all.
Net revenue retention
NRR = (Beginning MRR + Expansion MRR + Reactivation MRR − Contraction MRR − Churned MRR) ÷ Beginning MRR × 100
NRR counts gains and losses inside the existing base together, excluding new customers entirely. Above 100% means the base grows without acquisition.
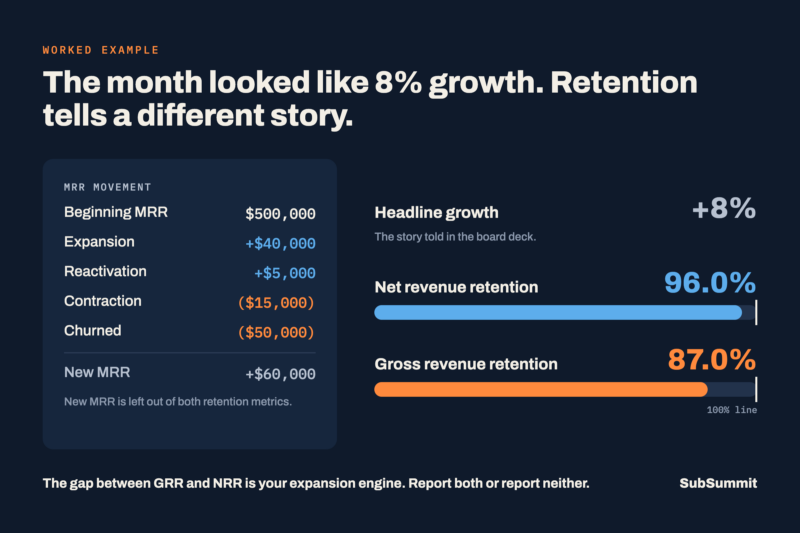
The gap between GRR and NRR is your expansion engine. A business at 85% GRR and 105% NRR has a serious retention problem masked by strong expansion, and the mask will come off the moment expansion slows. Report both or report neither.
Worked example. Beginning MRR 500,000. Expansion 40,000. Reactivation 5,000. Contraction 15,000. Churned 50,000. GRR = (500,000 − 15,000 − 50,000) ÷ 500,000 = 87.0% NRR = (500,000 + 40,000 + 5,000 − 15,000 − 50,000) ÷ 500,000 = 96.0% New MRR of 60,000 would produce headline growth of 8% and a story about a great month. Neither retention number supports that story.
Logo churn and revenue churn are different problems
Logo churn counts subscribers lost. Revenue churn counts dollars lost. Report both, because the relationship between them is diagnostic:
- Revenue churn materially above logo churn means you are losing your larger customers. This is an enterprise or high value segment problem.
- Logo churn materially above revenue churn means you are losing your smaller customers. This is usually an onboarding, pricing floor, or fit problem, and it is often acceptable.
Subscriber retention rate
Retention rate = (Subscribers at end of period − Subscribers acquired during period) ÷ Subscribers at start of period × 100
The mid period acquisition subtraction is the part teams get wrong. Without it, a strong acquisition month makes retention look better than it is.
Calculate this by cohort and by month of tenure, not as a single blended figure. A blended retention rate averages your month one losses against your month 24 loyalists and produces a number you cannot act on.
Section three: cohort analysis, which is where the real answers live
Every metric above is a summary. The cohort triangle is the underlying data structure, and building it correctly is the highest leverage analytics work most subscription teams have not done.
Structure. Rows are acquisition cohorts, typically by signup month. Columns are months of tenure, not calendar months. Cell values are either surviving subscribers or surviving revenue, expressed as a percentage of the cohort’s month zero value.
Reading down a column tells you whether retention is improving over time across cohorts. Reading across a row tells you the survival curve of a single cohort. Most teams only ever look at rows.
The asymptote is the number that matters. Plot a cohort’s survival curve and it will drop steeply for the first two to four periods and then flatten. That flattening level is the asymptote, and it represents the share of each cohort that becomes durable. Moving the asymptote by two points is worth more than moving month one retention by ten, because the asymptote applies to every future month.
Survival analysis. For a more rigorous version, use a Kaplan Meier estimator, which handles the censoring problem correctly. Censoring is the fact that a subscriber who joined two months ago has not had the opportunity to churn in month six, and naive cohort math either excludes them entirely, biasing the sample, or counts them as retained, biasing the result. Kaplan Meier accounts for this and produces a survival function you can compare across segments with a log rank test. If your team has an analyst, this is a two-day piece of work that will change how you allocate retention effort.
Hazard rate. The complement worth plotting alongside survival is the hazard rate, which is the probability of churning in a given period conditional on having survived to that period. The hazard rate shows you exactly where the risk concentrates. Most subscription businesses find a spike at the first renewal and a second smaller spike at the annual mark, and both are addressable with specific interventions rather than general retention effort.
Section four: unit economics
Customer acquisition cost
CAC = (Total sales and marketing spend in period) ÷ (New customers acquired in period)
Four decisions determine whether your CAC is comparable to anyone else’s, including your own from last quarter:
Blended or paid. Blended CAC divides all sales and marketing spend by all new customers, including organic. Paid CAC divides paid spend by paid acquired customers. Blended flatters, paid is decision useful. Report both, label which is which.
Fully loaded or media only. Fully loaded includes salaries, agency fees, tooling, and creative production. Media only includes ad spend. Fully loaded is the honest number for a board. Media only is the right number for a channel bid decision.
Attribution window. A customer who saw an ad in March and converted in May counts in which month’s CAC? Pick a convention, document it, and do not change it silently.
Reactivation exclusion. Returning customers are not new customers. If reactivations sit in your CAC denominator, your acquisition cost is understated.
CAC payback period
Payback period in months = CAC ÷ (ARPU × gross margin %)
This is the metric that determines how fast you can grow without running out of cash, and it is the one most consumer subscription businesses skip. A twelve-month payback with 5% monthly churn is a business that will not survive its own growth, because a meaningful share of each cohort churns before it repays acquisition.
Cross reference payback against your survival curve. If your payback period is longer than the tenure at which your survival curve crosses 50%, you are acquiring customers who are more likely than not to leave before paying you back.
Customer lifetime value
Four ways to calculate it, in ascending order of honesty.
- Naive. LTV = ARPU ÷ monthly churn rate. Fast, wrong, and everywhere. It assumes constant churn forever, ignores gross margin, and ignores the time value of money. It overstates by a wide margin.
- Gross margin adjusted. LTV = (ARPU × gross margin %) ÷ monthly churn rate. Better. Gross margin for a physical subscription includes cost of goods, fulfillment, shipping, and payment processing, which for a box business can put gross margin low enough that the naive number is off by a multiple.
- Discounted. LTV = (ARPU × gross margin %) ÷ (monthly churn rate + monthly discount rate). Applies a discount rate to future cash flows. Necessary once you are comparing LTV against a CAC you are financing.
- Cohort actuals. Sum the observed gross profit per cohort across observed tenure, then project the remainder using the fitted survival curve and its asymptote. This is the only method that does not assume constant churn, and constant churn is the assumption every other method makes and reality never honors.
Use method four for decisions. Use method two for a board slide. Never use method one for anything.
LTV to CAC. The commonly cited target ratio is a rule of thumb, not a law, and it is frequently quoted without the gross margin adjustment that makes it meaningful. A ratio computed on naive LTV against media only CAC can be triple the honest figure. If you report the ratio, state which LTV method and which CAC definition produced it.
The benchmarks, and why you should be careful with them
The 2026 Aleph and Benchmarkit SaaS and AI Performance Benchmarks, built from full year 2025 actuals across 342 software companies, put median CAC payback at 16 months, improved from 18 months the prior year. Top quartile recovers acquisition cost in 6 months or fewer. Bottom quartile takes 24 months or more. The same body of benchmark work puts median net revenue retention at roughly 101%, with top performers at 111% or better, and SaaS Capital’s research places median net revenue retention for private software companies at about 100%, meaning the median company has no expansion cushion at all.
Read that with a large caveat. Every one of those figures is B2B software. If you run a consumer subscription business, they describe a different industry with different gross margins, different contract lengths, and expansion mechanics that mostly do not exist in a box program. A DTC brand comparing itself to a 16-month payback benchmark is comparing itself to companies that can sell more seats to the same buyer.
Two things do transfer. The first is the direction of the finding, which is that payback periods lengthened materially from 2023 to 2024 before recovering, and that the spread between top and bottom quartile is wider than the median is interesting. The second is the methodological instruction embedded in how the figure is calculated: gross margin adjusted, with sales and marketing spend lagged against the ARR it produced. Most teams reporting payback do neither.
Until consumer subscription publishes a comparable payback dataset, calculate your own and compare it against your own survival curve rather than against software.
Section five: involuntary churn, the metric almost nobody instruments
Definition: the share of subscriber or revenue loss caused by a failed payment rather than a cancellation decision.
Involuntary churn requires its own measurement stack, not a single number. Instrument four:
Authorization rate. Successful charge attempts divided by total charge attempts, for recurring transactions specifically. Separate this from your one-time checkout authorization rate, because the two behave differently and are affected by different controls. There is no reliable, published benchmark for recurring authorization rate, because processors and card networks rarely segment recurring from one time volume in what they release. Treat this as a number to trend against your own history rather than against the industry.
Decline composition by reason code. Group declines into soft and hard. Soft declines are recoverable and should be retried. Hard declines are terminal and should route to a customer communication, not a retry. Retrying a hard decline burns retry attempts against network limits and can attract penalties. Your processor exposes these codes. Most teams never look at them.
Recovery rate. Of the transactions that failed, the share that eventually succeed, cut by reason code class and by recovery method. This tells you which of your recovery tactics is actually working.
Dunning funnel conversion. Treat the dunning sequence as a funnel with named stages: failed charge, notification delivered, notification opened, payment method updated, charge succeeded. Reporting only the final recovery rate hides whether your problem is deliverability, message clarity, or update friction, and those have completely different fixes.
What the benchmarks say
The involuntary share of total churn holds steady across independent datasets, which makes it the most portable benchmark available.
Stripe’s data, analyzed by Churnkey, puts involuntary churn at 22% of total churn for SaaS, 23% for merchandise, 26% for business services, and 29% for digital goods. Split by model, it is 24% of all churn for B2C companies against 16% for B2B.
Recurly’s July 2026 network figures produce a similar picture from a completely different dataset: 1.06 points of involuntary against 3.22 total for SaaS, and 1.38 against 4.25 for ecommerce, which is a 33% and 32% share respectively.
Two networks, different methodologies, incompatible absolute rates, and a consistent answer on the ratio. Roughly a quarter to a third of subscription churn is a payments problem.
Price point drives it more than category does. Stripe’s data shows involuntary churn at 35% of total churn for subscriptions under 10 dollars average order value, falling to 15% in the 1,000-to-10,000-dollar band. Recurly’s ARPC cut shows the same shape from the other side: involuntary churn of 1.30% in the 10-to-25-dollar band against 0.18% above 250 dollars, a drop of 87% across the range.
For a DTC subscription brand at a typical consumer price point, this is the single most important line in this post. Your involuntary share is likely at the high end of every range above.
Involuntary churn is the cheapest churn to reduce because those subscribers never chose to leave. It is also the churn most often buried inside a blended number, which is why it stays unaddressed.
Section six: the data model this all requires
Every metric above assumes you can answer the question “what did the subscriber base look like on a given historical date.” Two architectures do this, and one of them does it badly.
Snapshot architecture. Store the state of every subscription at the end of each period. Simple to build, simple to query, and it silently loses anything that happened between snapshots. A customer who upgraded and downgraded within one month appears not to have moved. Mid period signups and cancellations vanish.
Event architecture. Store every state change as an immutable, timestamped event: created, activated, upgraded, downgraded, paused, resumed, cancelled, charge attempted, charge failed, charge succeeded, refunded. Every metric becomes a query over the event log, history can be reconstructed as of any date, and definition changes can be applied retroactively to prior periods.
Event architecture is more work up front and it is the only one that supports the cohort analysis in section three. If you are choosing now, choose events.
Minimum event schema: event id, subscription id, customer id, event type, event timestamp, effective timestamp, MRR delta, currency, plan id, quantity, source system. Event timestamp and effective timestamp differ more often than teams expect, and conflating them produces reconciliation failures in the MRR waterfall.
Section seven: ten measurement errors to check for this week
- Mid period acquisitions not excluded from the retention rate denominator, inflating retention in high growth months.
- Annual contracts booked as a spike in the month collected rather than normalized across the term.
- Reactivations counted as new, understating CAC and overstating new customer acquisition.
- Pauses and skips treated inconsistently, sometimes as churn and sometimes as contraction, in the same reporting period.
- Involuntary churn blended into voluntary, making a billing problem look like a product problem.
- Blended retention reported without cohorts, averaging away the only actionable signal.
- LTV computed on naive constant churn and compared to a media only CAC, producing a ratio that can be several times the honest one.
- One time and services revenue inside ARR, which will be caught in diligence.
- Currency converted at spot per transaction, showing exchange movement as expansion and contraction.
- No named owner per metric. Metrics without an owner get reported and never acted on.
Section eight: cadence and ownership
Weekly: New MRR, Churned MRR, involuntary churn count and recovery rate, second cycle conversion rate, authorization rate.
Monthly: full MRR waterfall with reconciliation check, GRR, NRR, quick ratio, ARPU by cohort, CAC and CAC payback.
Quarterly: cohort survival curves with asymptote, hazard rate by tenure, LTV to CAC by acquisition channel, plan and tier distribution.
Assign every metric a single named owner. Not a team, a person.
Maintain a metrics dictionary as a living document: for each metric, the formula, the inclusion and exclusion rules, the source system, the owner, and the date of the last definition change. When someone asks why the finance number and the dashboard number differ, the dictionary is the answer or there is no answer.
The retention curve, and the one benchmark worth borrowing
Absolute churn rates do not travel between datasets. Retention curve shape does, because it is expressed as a percentage of each cohort’s own starting point rather than against a disputed denominator.
Recharge, drawing on benchmarks across more than 20,000 subscription merchants, reports that subscribers hold an average of 45% retention at six months and 33% at twelve. Against that, a typical one-time ecommerce customer has roughly a 20% chance of returning after 200 days.
Two things follow.
The subscription premium is real and it is measurable. A third of subscribers still active at twelve months against a one in five chance of a single repeat purchase is the entire business case for the model, and it is why a subscription can carry a higher acquisition cost than a one-time product.
The curve is front loaded. Losing more than half of a cohort in the first six months, then only 12 more points across the following six, is the classic shape: a steep early drop and a flattening afterward. Which means the aggregate number almost every brand reports is hiding the part that matters. A business reporting 5% blended monthly churn is frequently combining a first month figure several times higher with a stable older base, and the blend conceals both.
The instruction. Do not benchmark your blended churn rate against anything in this report. Benchmark the shape of your curve: where it drops, where it flattens, and at what level. That comparison is valid across datasets in a way the rate is not.
Where the categories differ
Two consistent splits show up across sources and are worth knowing before you set a target.
Replenishment against curation. Products that ride an existing consumption habit retain materially better than products that must re earn the purchase decision every cycle. A supplement subscription and a curated box are different businesses with different curves, and comparing either to a cross-category average produces a false verdict on both.
Billing interval. Longer prepaid terms retain better, for the mechanical reason that they present fewer renewal decisions and fewer opportunities for a payment to fail. That effect is well documented directionally across platform reporting, though the published magnitudes vary widely enough that we are not quoting a multiplier here. Test it on your own base. The Week 1 pricing post has the math for setting the discount.
Frequently asked questions
What metrics matter most for a subscription business?
Net revenue retention, involuntary churn rate, and CAC payback period. Net revenue retention shows whether the existing base grows without acquisition. Involuntary churn shows how much revenue is lost to billing failure rather than dissatisfaction. CAC payback period shows how quickly the business recovers acquisition cost, which determines how fast it can grow without running out of cash.
What is the difference between gross revenue retention and net revenue retention?
Gross revenue retention counts only losses from the existing base and cannot exceed 100%. Net revenue retention counts losses and gains within the existing base together, including upgrades and reactivations, and can exceed 100%. The gap between the two is the size of the expansion engine masking any retention problem.
How is subscriber retention rate calculated?
Subtract subscribers acquired during the period from subscribers active at the end of the period, divide by subscribers active at the start of the period, and multiply by 100. Excluding mid period acquisitions is the step most often missed, and skipping it inflates retention during high growth months.
What is the MRR movement waterfall?
A decomposition of the change in monthly recurring revenue into new, expansion, reactivation, contraction, and churned components. Ending MRR should equal beginning MRR plus new plus expansion plus reactivation minus contraction minus churned. If the identity does not reconcile, the underlying subscription event data has gaps.
How should customer lifetime value be calculated?
The most defensible method sums observed gross profit per acquisition cohort across observed tenure, then projects the remainder from the fitted survival curve. The common shortcut of dividing ARPU by churn rate assumes constant churn forever and ignores gross margin, which overstates lifetime value substantially for physical subscription businesses.
What is a quick ratio in subscription metrics?
New MRR plus expansion MRR divided by contraction MRR plus churned MRR. It expresses how many dollars of recurring revenue the business adds for every dollar it loses. A quick ratio near 1 means growth and loss are cancelling out regardless of how strong the acquisition numbers look on their own.
Why do published subscription churn benchmarks disagree so much?
Because publishers use different denominators, treat mid period acquisition differently, handle reactivation differently, and apply the same period label to different calculations. Two major billing networks published figures in the last year that differ by an order of magnitude for the same industry, both labeled annual churn. Read the methodology before using any published figure, and never compare two of them to each other.
What is the most reliable subscription benchmark to compare against?
The involuntary share of total churn, meaning the portion of churn caused by failed payments rather than cancellations. It holds at roughly a fifth to two fifths across eight independent datasets, because it is a ratio within a single dataset rather than a rate against a disputed denominator. Absolute churn rates do not travel between sources.
Should ARR include one-time revenue?
No. ARR should include only contracted recurring revenue. Setup fees, one-time purchases, and services revenue are not recurring and including them overstates the run rate. They should be reported separately, and ARR should never be presented as though it were recognized revenue.
Nine metrics, one dictionary, one owner per line. Most teams have the dashboard. Fewer have agreed what the numbers mean.
Primary datasets
Recurly, “Churn rate benchmarks.” Network data as of July 2026. https://recurly.com/research/churn-rate-benchmarks/ Churn by industry and by average revenue per customer, split voluntary and involuntary. Vendor published, sample is Recurly’s merchant network.
Recurly, “2026 State of Subscriptions.” Released 14 January 2026. 2,200 subscription businesses, 76 million unique subscribers. https://recurly.com/resources/report/state-of-subscriptions/ Consumer behavior, pause and reactivation data, billing plan adoption, recovered revenue by industry.
Churnkey with Stripe, “Involuntary churn benchmarks and tactical advice.” Published 14 November 2025. https://churnkey.co/blog/involuntary-churn-benchmarks Methodology: Stripe 2024 volume of 1.4 trillion dollars across 200 million subscriptions, combined with Churnkey retention data across 5.4 million failed payments and 25 million subscriptions over one year. Churn by industry, business model, and average order value. Decline code distribution. Retry and dunning recovery rates.
Recharge, State of Subscription Commerce and Subscription Trend Report 2026. Benchmarks across more than 20,000 subscription merchants. https://getrecharge.com/reports/subscription-trend-report-2026/ Retention curve at six and twelve months, order frequency against one time shoppers, category benchmarks.
2026 Aleph and Benchmarkit SaaS and AI Performance Benchmarks. Full year 2025 actuals, 342 software and AI native companies. Median CAC payback 16 months, improved from 18. Top quartile 6 months or fewer, bottom quartile 24 months or more.
Benchmarkit 2025 SaaS Performance Metrics. Median net revenue retention approximately 101%, top performers 111% or higher. Median cost to acquire one dollar of new ARR of two dollars. Gross margin 77% total and 81% on subscription revenue.
SaaS Capital retention research. Median net revenue retention for private SaaS companies approximately 100%.